Insights - Beta Release
Important - This view is currently being rolled out to select organisations as a beta release. If you don't see this view, it will not be available to you.
To learn more about our standard insights feature tab, click here: https://help.genio.co/article/405-insights
Your Genio Admin Portal shows you data on how your Organisation subscription is being used.
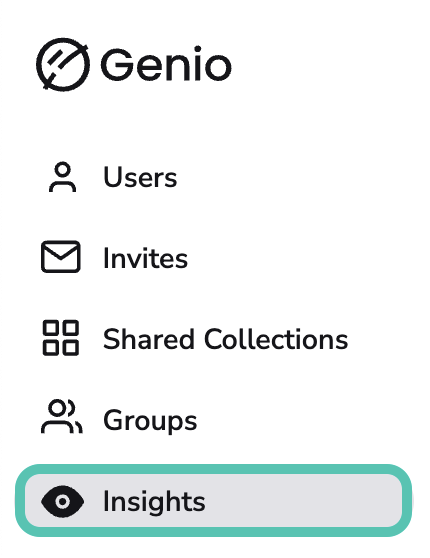
To access your insights, click the Eye icon on the left-hand panel:
Overview
The insights page is made up of several different tabs. This data is pulled live from our database, so the metrics are always up to date.
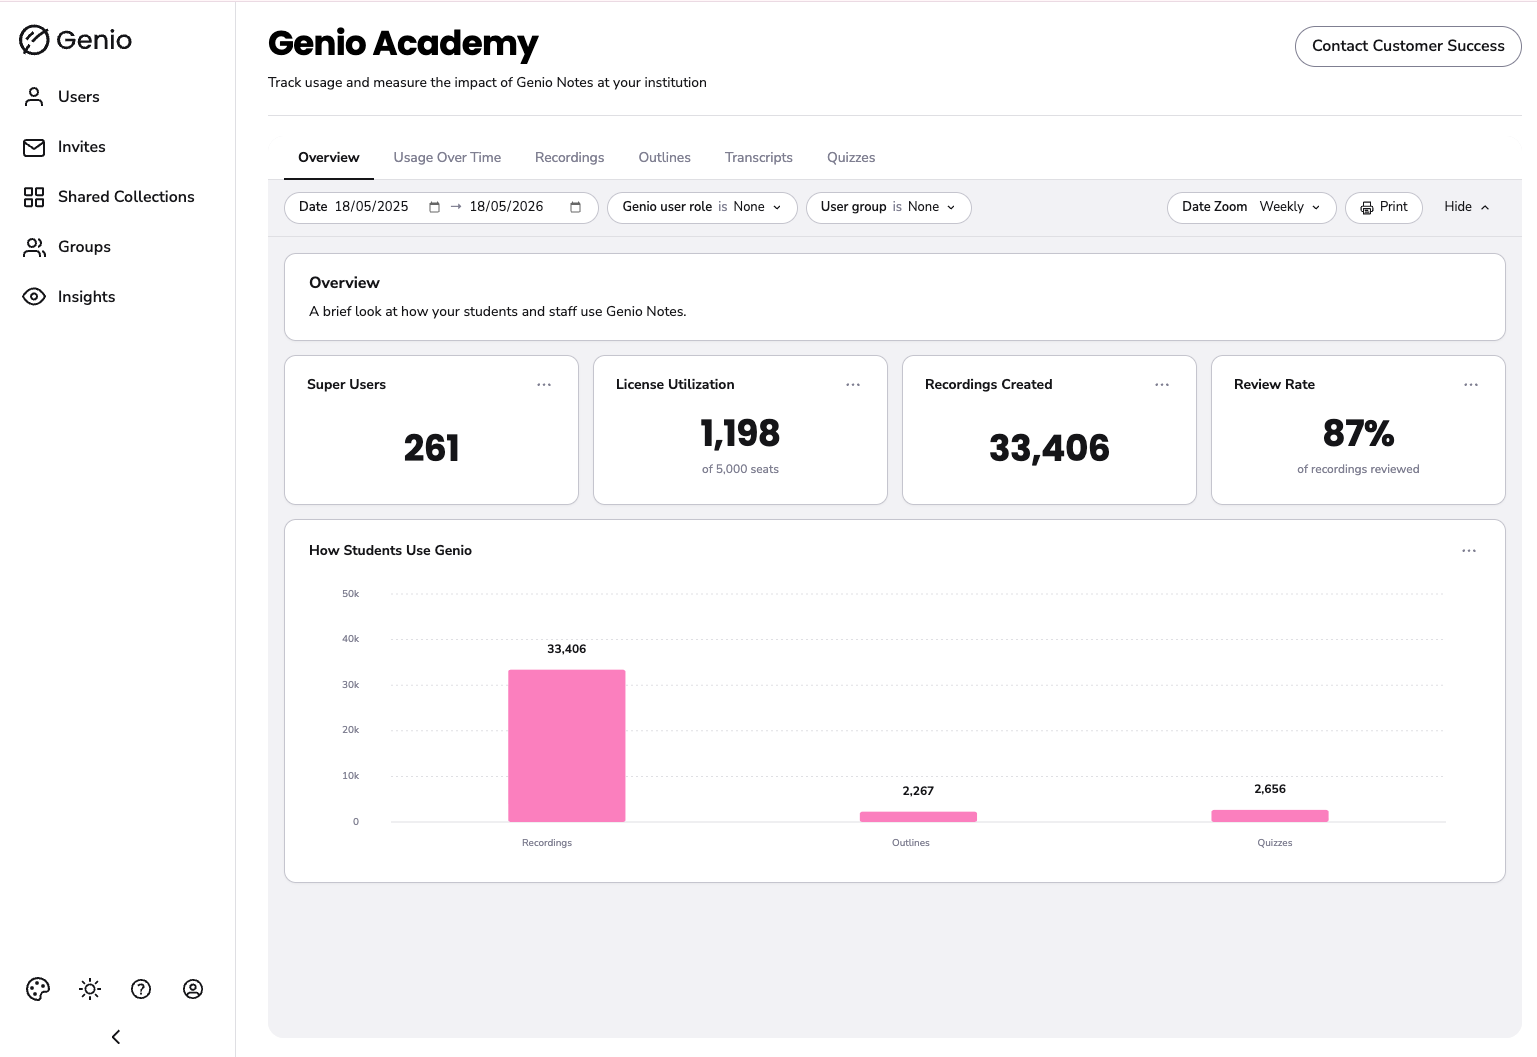
When you first navigate to the insights tab, you will land on the Overview tab, which gives you a quick snapshot of students' activity:
Exploring and Filtering Data
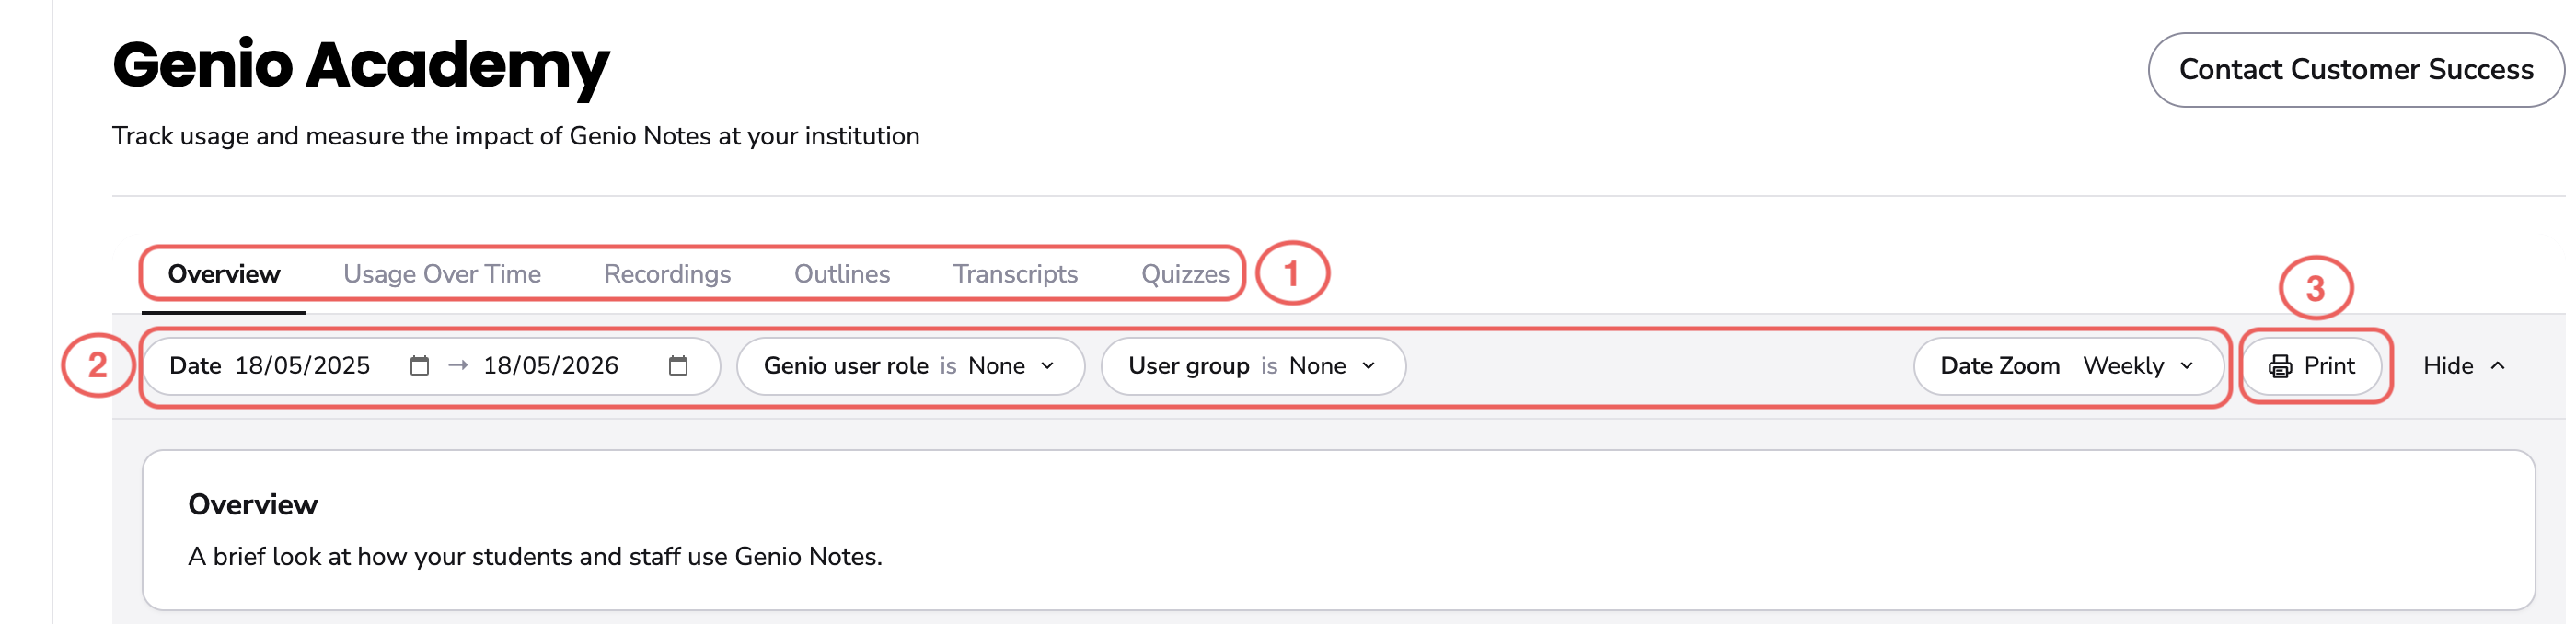
You can customise your view, filter metrics, or export reports using the tools at the top of the page:
Note - Any filter options you set will remain active as you switch between different data tabs.
1. Data Tabs
Switch between tabs to see specific feature breakdowns:
Overview: A snapshot of total usage.
Usage Over Time: Trends and patterns in platform activity.
Recordings, Outlines, Transcripts, & Quizzes: Deep-dive metrics for each specific feature.
2. Data Filters
Narrow down your data to find exactly what you need. You can filter by:
Timeframe (specific calendar date ranges)
Date Zoom ( Daily, Weekly, Monthly, Yearly)
Role ( None, Administrator, Educator)
Groups
3.Printing/exporting data
Click 'Print' to export the data displayed in your current tab.
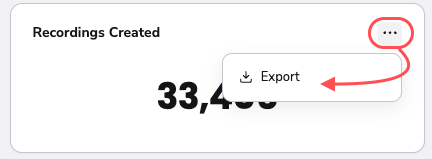
You can also export data from individual fields within the data tabs. If you see a three-dot icon in the top-right corner of a field, click it to export that specific data. For example: